
A blood pressure log records measurements over time so you can share them with a healthcare professional. Systolic pressure is the upper reading during a heartbeat; diastolic pressure is the lower reading between beats. These templates organize readings and do not diagnose or treat a condition.
View the templates and existing download links below.
Choosing the right format
Distinguish a blank recording log from a chart that lists clinical categories. Choose a log with space for both readings and their date and time. Follow your healthcare professional’s advice about when and how to measure rather than relying on a generic template.
Details to include
- Date and time of each measurement
- Systolic and diastolic readings in mm Hg
- Relevant notes and any additional information requested by your clinician
How to use the template
- Use the device and measurement procedure recommended for you.
- Record the displayed numbers accurately without swapping the columns.
- Bring the log to appointments and discuss concerning readings with your healthcare professional.
Worked example
An illustrative entry is ’12 October, 08:00 | systolic 118 | diastolic 76 | morning reading’. This example demonstrates recording only and is not a personal target or diagnosis.
See the American Heart Association’s explanation of blood pressure readings for the meaning of the two numbers. Clinical interpretation belongs with a healthcare professional.
Download and printing notes
The existing links include ZIP, XLSX files. ZIP files are bundles; check their contents after downloading. XLSX files use the Excel workbook format. Check editability, software compatibility and any formulas in the actual file before relying on them.
Why keep a written blood pressure record
Blood pressure changes from minute to minute. It rises with stress, exercise, caffeine and even the walk into a clinic, and it falls during rest and sleep. A single reading in a doctor’s office is therefore only a snapshot. A home blood pressure chart collects many readings over days and weeks, giving you and your healthcare professional a much clearer picture of what is normal for you.
Doctors often ask patients to keep a log when starting or adjusting medication, when office readings seem higher than usual, or when monitoring pregnancy, kidney disease or diabetes. A neat, consistent chart makes that log easy to review during a short appointment.
This page offers record-keeping templates. It does not provide medical advice. Always follow the monitoring plan and targets given by your own doctor, nurse or pharmacist.
What a blood pressure chart records
Date and time
Readings vary by time of day, so record both.
Systolic pressure
The top number, measuring pressure when the heart beats.
Diastolic pressure
The bottom number, measuring pressure between beats.
Pulse
Heart rate in beats per minute, shown by most automatic monitors.
Arm used and position
Left or right arm, sitting or standing. Consistency matters.
Notes
Medication taken and time, symptoms such as dizziness or headache, recent exercise, caffeine or stress.
Download Blood Pressure Chart Templates Below
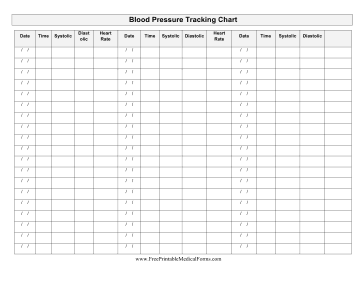

Blood Pressure Chart Format
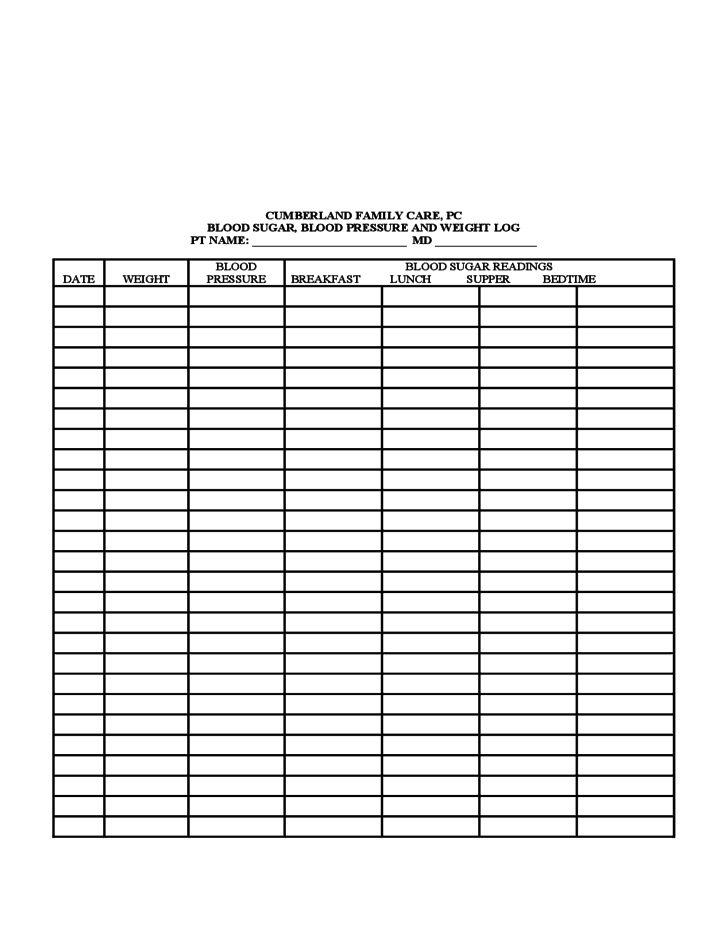
Blood Pressure Chart Printable

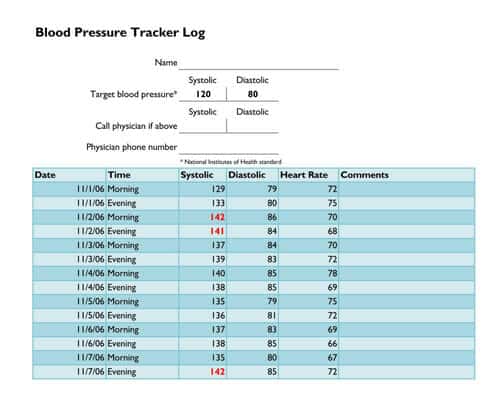
Excel Blood Pressure Chart


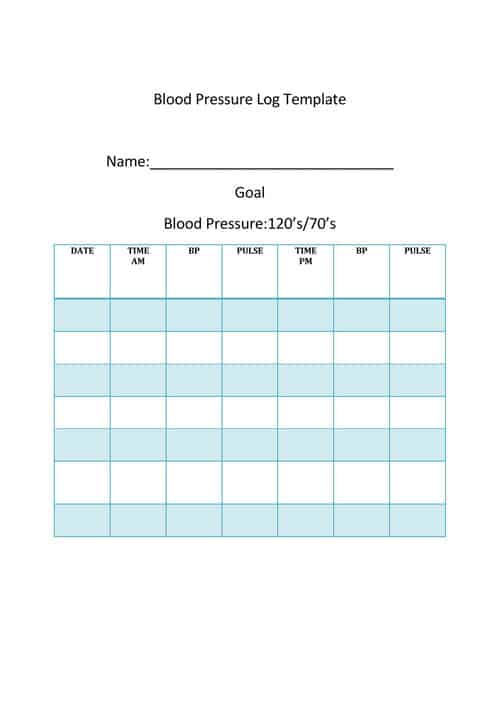


Understanding the numbers
Readings are written as systolic over diastolic, for example 128/82 mmHg. Many charts include color bands based on published guidelines. For example, the American Heart Association’s adult categories describe below 120/80 as normal, systolic 120–129 with diastolic below 80 as elevated, 130–139 or 80–89 as stage 1 hypertension and 140/90 or higher as stage 2. Other organizations, such as European societies, use slightly different thresholds. Your doctor may set a personal target based on your age and health, so use their guidance rather than a general chart to interpret your results.
Very high readings or readings accompanied by symptoms such as chest pain, shortness of breath, severe headache, weakness or confusion need urgent medical attention. Follow local emergency advice.
How to take and record readings accurately
- Avoid caffeine, smoking and exercise for at least 30 minutes beforehand.
- Empty your bladder and sit quietly for five minutes with your back supported and feet flat on the floor.
- Rest your arm on a table so the cuff is at heart level.
- Use a cuff of the correct size, placed on bare skin.
- Do not talk during the measurement.
- Take two or three readings one minute apart and record each one.
- Measure at the same times each day, commonly morning before medication and evening.
- Write the readings in the chart immediately, rather than relying on the monitor’s memory alone.
Choosing the right chart template
Daily log
Rows for morning and evening readings each day of the month. Ideal for a two-to-four-week monitoring period.
Weekly chart
A compact layout for longer-term monitoring, with one or two readings per day.
Chart with color bands
Shows where each reading falls on a reference scale; useful for visual learners, but interpret with your doctor’s targets.
Excel tracker
Calculates averages automatically and can produce a line graph of trends.
Family or caregiver chart
Includes space for the person’s name, medication list and caregiver notes.
Tips for a useful log
- Bring the chart to every appointment.
- Calculate your weekly average; one high reading is less important than the overall trend.
- Use the same monitor and arm each time.
- Check your monitor has been clinically validated and compare it with the clinic’s device occasionally.
- Note any changes in medication, illness or sleep.
- Keep the chart with your other health records, such as medication lists and appointment letters, in one binder you actually use.
- If you miss a reading, leave the row blank rather than estimating.
Common mistakes
- Measuring right after activity. Readings will be higher than your resting level.
- Wrong cuff size. A cuff that is too small tends to overestimate pressure.
- Recording only “good” readings. Your doctor needs the full picture.
- Changing medication based on home readings alone. Discuss changes with your prescriber.
- Irregular timing. Readings at random times are harder to compare.
Worked example: a two-week log before a medication review
Robert, 61, has been asked by his doctor to measure his blood pressure twice daily for two weeks. Each morning at 7:00, before breakfast and medication, he sits for five minutes and takes two readings one minute apart, then repeats at 8:00 pm. He writes both readings and his pulse in a daily log, plus notes such as “poor sleep” or “walked 40 minutes”.
At the end of week one, his morning readings range from 136/86 to 148/90 and evening readings are slightly lower. He adds the averages at the bottom of each week. At his appointment, the doctor reviews the chart, sees a consistent pattern rather than a one-off spike, and uses it to decide the next step. Robert keeps the chart in a folder with his medication list and an emergency contact list.
Using a spreadsheet to spot trends
If you are comfortable with Excel or another spreadsheet, enter each reading in a row with columns for date, time, systolic, diastolic and pulse. Simple formulas can calculate weekly averages, and a line chart shows trends far more clearly than a column of numbers. Keep the printed chart as your daily record and update the spreadsheet once a week, then print the graph for your next appointment. A tidy daily planner can remind you of measurement times.
Caring for someone else
Caregivers who track a parent’s or partner’s blood pressure should write the person’s name and date of birth at the top of the chart, list current medications and note who took each reading. If several family members share the task, agree on the same routine so readings remain comparable.
Blood pressure chart FAQs
How many readings should I record each day?
Follow your doctor’s instructions. A common pattern is two readings in the morning and two in the evening during a monitoring period.
Should I use my left or right arm?
Your clinician may check both at first and advise which to use. After that, use the same arm consistently.
Can I use a wrist monitor?
Upper-arm monitors are usually recommended. If you use a wrist monitor, keep your wrist at heart level and ask your clinician whether it is suitable.
Is one high reading a problem?
A single reading may be influenced by many factors. Look at averages and patterns, and contact a healthcare professional if you are concerned or have symptoms.
Should I record pulse as well?
Yes. Your pulse can help your doctor interpret readings and the effects of some medications.
Can I share my chart digitally?
Yes. Scan or photograph the chart, or share the Excel file, using a secure method your clinic accepts.
Related templates
For other health and care records, see our pet record templates for veterinary visits and prescription pad templates for clinic stationery. More printable charts are in the templates category.
Conclusion
A blood pressure chart turns scattered readings into useful information. Measure under consistent conditions, record every reading with time and notes, calculate averages and bring the chart to your appointments. Download a daily, weekly or Excel template above.
Related templates
For related tasks, see Free Daily Planner Templates and Scheduling Example.